The following activity demonstrate the properties unique to the 2D FT. 2D FT means applying the FT twice (once along the x and another along the y).
A. Fourier Transform of Different Patterns
Below are some patterns and their corresponding FT. (Click the image for a larger view.)


Figure 1. Top row: Some arbitrary patterns. Bottom row: Their corresponding FFT.
B. Anamorphic Property of the Fourier Transform
Basically, the FT gives the frequencies present in the input image. It treats the image as a sum of sinusoids. Below are sinusoids of different frequencies and their corresponding FT.


Figure 2. Top row: Sinusoids with frequencies 1Hz, 3Hz, 5Hz and 9Hz respectively
In figure 2, the white spots represents the frequencies of the sinusoids. The center of the images at the bottom row represents 0 Hz, thus increasing the frequency will result in white spots moving away from the center. The two symmetric white spots occur because the output of FFT is always symmetric with the center.
If we add a constant signal which effectively has a frequency equal to zero, it will result in a white spot at the center. Figure 3 demonstrate this by adding a value equal to 1 to a 1 Hz sinusoid.
If we add a constant signal which effectively has a frequency equal to zero, it will result in a white spot at the center. Figure 3 demonstrate this by adding a value equal to 1 to a 1 Hz sinusoid.
Figure 3. FFT of a 1 Hz sinusoid with constant bias.
Adding a non-constant bias, for example another sinusoid, will result into another white spot representing the frequency of the added noise. (See figure 4.)


Figure 4. Left: Sum of a 3 Hz and a 0.1 Hz. Right: Its FFT.


Figure 4. Left: Sum of a 3 Hz and a 0.1 Hz. Right: Its FFT.
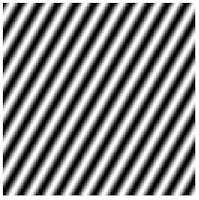
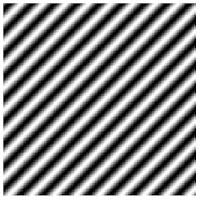
Rotating the image will result in a rotated FFT. See images below.


Figure 5. 3 Hz sinusoid rotated at 30, 45 60 and 90 degress.
Combining two sinusoids in X and in Y will result in FTTs with white spots having coordinates given by the frequencies in X and in Y. Below are products of two sinusoids with equation sin(2*pi*fx*X)sin(2*pi*fy*Y)


Figure 6. Top row (left): Product of sinusoids with fx=4 Hz and fy=4 Hz. Top row (right): Its FFT. Bottom row (left): Product of sinusoids with fx=4 Hz and fy=2 Hz. Bottom row (right): Its FFT.


Figure 5. 3 Hz sinusoid rotated at 30, 45 60 and 90 degress.
FFT can also be used in noise reduction in a signal. Usually, noise are the higher frequencies in signal. By taking the FFT of a signal and removing the higher frequency, noise can be removed.
Combining two sinusoids in X and in Y will result in FTTs with white spots having coordinates given by the frequencies in X and in Y. Below are products of two sinusoids with equation sin(2*pi*fx*X)sin(2*pi*fy*Y)


Figure 6. Top row (left): Product of sinusoids with fx=4 Hz and fy=4 Hz. Top row (right): Its FFT. Bottom row (left): Product of sinusoids with fx=4 Hz and fy=2 Hz. Bottom row (right): Its FFT.
For the final part of the activity, I sum up the above sinusoids, in particular sin(2*pi*4*X)*sin(2*pi*4*Y) and sin(2*pi*3*X) rotated at 30, 45, and 90 degrees and get the FFT. As expected, the FFT will just be the sum their respective FFTs. It will be helpful to refer back to the images above and compare it with the FFT image below.


No comments:
Post a Comment