Fourier transform of an image gives the spatial frequencies present in it. Because of this property of the FT it has been used to remove unwanted patterns. It will be demonstrated later how this fact will help improve the quality of an image.
A. Convolution Theorem
Convolution simply means "a little bit of the other". The FT of a convolution of two functions in space is the product of the two functions' FT
A. Convolution Theorem
Convolution simply means "a little bit of the other". The FT of a convolution of two functions in space is the product of the two functions' FT
FT [ f ∗g ]=FG
Below are images which display this fact.


Figure 1. Top row: Two symmetric dots and its FT. Middle row: Two symmetric circles and its FT. Bottom row: Two symmetric squares and its FT.


Figure 1. Two symmetric Gaussian dots and their respective FTs. Top row: Variance = 4. Middle row: Variance = 10. Bottom row: Variance = 25.


Figure 1. Top row: Two symmetric dots and its FT. Middle row: Two symmetric circles and its FT. Bottom row: Two symmetric squares and its FT.
The two dots represent two dirac-delta functions which has a sinusoid FT. The location of the dots represents the spatial frequency. The image with two circles is the convolution of two dirac-delta and a circular aperture with a zero-order Bessel function as its FT. The FT of the two circles is just the product of the FT of the two dirac-delta(i.e a sinusoid) and the FT of the circular apperture (i.e. Bessel function). The same goes for the square only that its FT is a sinc function in two dimensions.
FT is also an anamorphic transform. If the spacing is small in the real space domain it will be bigger in the inverse space. Below are images of two Gaussian dots of increasing radius (i.e. increasing variance) and their respective FTs.


Figure 1. Two symmetric Gaussian dots and their respective FTs. Top row: Variance = 4. Middle row: Variance = 10. Bottom row: Variance = 25.
The Gaussian dots are generated by the following code
[x,y]=meshgrid(linspace(-10,10,128),linspace(-10,10,128));
mu=5;
var=20;
I=exp(-(((x+mu).^2+y.^2).^2)./var^2)+exp(-(((x-mu).^2+y.^2).^2)./var^2);
We also compare the real and imaginary part of the Gaussian dots with its inverted counterpart.


Figure 3. Comparison between the real part of two Gaussian dots ( top left) and its inverted counterpart ( top right). The bottom row corresponds to the imaginary parts.
[x,y]=meshgrid(linspace(-10,10,128),linspace(-10,10,128));
mu=5;
var=20;
I=exp(-(((x+mu).^2+y.^2).^2)./var^2)+exp(-(((x-mu).^2+y.^2).^2)./var^2);
We also compare the real and imaginary part of the Gaussian dots with its inverted counterpart.


Figure 3. Comparison between the real part of two Gaussian dots ( top left) and its inverted counterpart ( top right). The bottom row corresponds to the imaginary parts.
From figure 3. We can see that inversion only affects the real part of the FT.
B. Fingerprint: Ridge Enhancement
B. Fingerprint: Ridge Enhancement
Since FT gives the spatial frequencies present in the image, it then also possible to remove unwanted frequencies through filtering. Basically, a filter is a mask that will block out unwanted frequencies. For this part, we will use a binary image for our filter.


Figure 4. Top left: The original image. Top right: Its FT in logarithmic scale. Bottom left: The filter. Bottom right: The filter image.
D. Canvas Weave Modeling and Removal


Figure 4. Top left: The original image. Top right: Its FT in logarithmic scale. Bottom left: The filter. Bottom right: The filter image.
The frequencies corresponding to the fingerprint those that have lighter color (figure 4 top right). Hence we design a filter that highlights that part and zero out the rest of the frequencies. The reconstructed image has continuous ridges compare to the original showing that the method works although the image appears blur since higher frequencies are removed. High frequencies are required for sharp edges.
C. Lunar Landing Scanned Pictures: Line Removal
For this part, we will also use the same method as above only that we will this time remove unwanted features in the picture, that is the vertical and horizontal lines.


Figure 5. Top left: The original image. Top right: Its FT in logarithmic scale. Middle left: Filter to remove vertical lines. Middle right: Another filter to remove both vertical and horizontal lines. Bottom left: Filtered image with vertical lines removed. Bottom right: Filtered image with both vertical and horizontal lines removed.
C. Lunar Landing Scanned Pictures: Line Removal
For this part, we will also use the same method as above only that we will this time remove unwanted features in the picture, that is the vertical and horizontal lines.


Figure 5. Top left: The original image. Top right: Its FT in logarithmic scale. Middle left: Filter to remove vertical lines. Middle right: Another filter to remove both vertical and horizontal lines. Bottom left: Filtered image with vertical lines removed. Bottom right: Filtered image with both vertical and horizontal lines removed.
The filtered image (especially figure 5 bottom right) appears cleaner.
For this part a more complex image will be enhanced. The canvas weave pattern contains horizontal,vertical and diagonal lines


Figure 6. Top left: The original image. Top right: Its FT in logarithmic scale. Middle left: Filter to remove diagonal canvas weave. Middle right: Another filter to remove diagonal, vertical and horizontal canvas weave. Bottom left: Filtered image with diagonal canvas weave removed. Bottom right: Filtered image with diagonal, vertical and horizontal canvas weave removed.


Figure 6. Top left: The original image. Top right: Its FT in logarithmic scale. Middle left: Filter to remove diagonal canvas weave. Middle right: Another filter to remove diagonal, vertical and horizontal canvas weave. Bottom left: Filtered image with diagonal canvas weave removed. Bottom right: Filtered image with diagonal, vertical and horizontal canvas weave removed.
As with the above, filtered images are cleaner although the brushstrokes are not apparent.
We also inverted the filter and take its FT to see if we can recover the canvas weave.


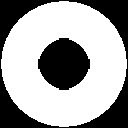
Figure 7. Top row: The inverse of the filter in figure 6 and its FT. Bottom row: The other filter and its FT
For this activity I'll give myself a 10 for completing the activity, though the fingerprint result is not satisfactory but at least I did my best. ^_^
We also inverted the filter and take its FT to see if we can recover the canvas weave.


Figure 7. Top row: The inverse of the filter in figure 6 and its FT. Bottom row: The other filter and its FT
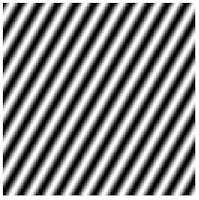
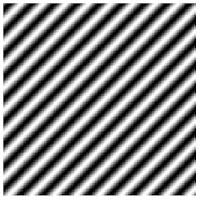
The canvas weave are recovered for each filter although they are not uniform. This indicates that the filter is not perfect or asymmetric.
Paint.NET
For this activity we used lots of editing in making the filter. For reasons of quality I always save my images in PNG format, however MS Paint cannot open PNG files which is troublesome since I have to export it again to a compatible format. Then I found Paint.NET while searching how to make PNG compatible with MS Paint. It is an alternative to MS Paint but has more tools. It is almost similar to Adobe Photoshop and GIMP. The good thing is that it only takes less than 4MB of disk space. Visit: http://www.getpaint.net/index.html
Note: This is available only for Windows and requires Microsoft .NET Framework 3.5 SP1 (which can be downloaded for free at the Microsoft website).
Acknowledgements
I would like to thank Luis Buno for helpful discussions especially with recovering the canvas weave. Special thanks also to my late night buddies (i.e. cramming buddies).
For this activity I'll give myself a 10 for completing the activity, though the fingerprint result is not satisfactory but at least I did my best. ^_^


